I’ve been developing a template for building cross-platform, hybrid cloud ready applications. The key concepts are:
- Use a browser for the gui because browsers are robust, flexible, and ubiquitous.
- Use a programming language that is cross platform so there is only one code-base for all targets.
- Include in “cross-platform” the idea that the application can easily scale from a single desktop to a local LAN (like a logging program on Field Day, or a federated SDR control application) all the way up to “the cloud” be that home-lab, private, hybrid, or public “cloud.”
- Include an open API so that the application can be extended by other interfaces, and automated via other applications and scripts.
The keys to this solution are: Chrome (or chrome based browsers) and the Go programming language. Chrome based browsers are essentially “the standard” on the ‘web; and Go is fast, flexible, cross-platform, and contains in it’s standard libraries all of the machinery you need for creating efficient micro-services, APIs, and web based applications. (you can create a basic web service in just a few lines of code!)
Working on the GoUI framework, adding a “Protect” middleware for basic rate limiting and dynamic allow/block listing.
It’s good practice to presume that any application that will live “online” will also be abused and so should have some defenses against that. A good starting point is rate limiting and source limiting… For example a desktop application that runs it’s gui in the browser should only listen to the local machine; and even if that’s the only device that ever connects to the application some sanity checks should be in place about those connections. To be sure, if you also want such an application to be shareable on a lan or scalable up to the cloud it must be even more robust…
While researching this I discovered that all of the rate limiting strategies I’ve come upon are quite literal and often complicated ways of actually counting requests/tokens in various buckets and then adding and removing counts from these buckets.
I think these miss the point… which is “rate” limiting. That is — how fast (at what rate) and from where are requests coming in. Token counting mechanisms also struggle with the bursty nature of normal requests where loading a page might immediately trigger half a dozen or more (at minimum) immediate requests associated with the UI elements on that page.
I’m going to simplify all of that by inverting the problem. Rather than count events and track some kind of sliding window or bucket scheme I’m going to measure the time between requests and store that in a sliding weighted average. Then, for any particular user I only need two numbers — the time of the last request (to compute how long since the previous request) and the running average.
Then the tuning parameters are fairly simple… The weights for the sliding average, the threshold for limiting, and a TTL so that users that go away for a while are forgotten.
Say the rate you want is at most 10 requests per second. That’s a simple enough fraction 10/1 … which, when inverted, means that your target is 1/10th of a second on average between each request.
Average_Weight = 10
Request_Weight = 1
Limit = 100ms (1/10th of a second is 100ms)
Suppose that when a new user arrives (or returns after being forgotten) we give them the benefit of the doubt on the first request:
Average = 1000ms
TimeSinceLastRequest = 1000ms
Average = (Average * 10) + (TimeSinceLastRequest * 1) / 11
1000 = 10000 + 1000 / 11 so no change
Then the page they loaded triggers 5 more requests immediately… I’ll show fractions to spare you the weird upshift into integer space.
909.091 = 10000 + 0 / 11
826.456 = 9090.91 + 0 / 11
751.315 = 8264.56 + 0 / 11
683.013 = 7513.15 + 0 / 11
620.921 = 6830.13 + 0 / 11
620 is still bigger than (slower than) 100ms so they’re still good and don’t get limited… Even better, when they wait a second (or so) before making a new request (like an ordinary user might) they get credit for that.
655.383 = 6209.21 + 1000 / 11 (see, the average went up…)
Now see what happens when an attacker launches a bot to abuse the service — maybe hitting it once every 10ms or so.
1000 = 10000 + 1000 / 11 (benefit of the doubt on the first hit)
910.000 = 10000 + 10 / 11
828.181 = 9100.00 + 10 / 11
753.802 = 8281.81 + 10 / 11
686.183 = 7538.02 + 10 / 11
624.712 = 6861.83 + 10 / 11
568.829 = 6247.12 + 10 / 11
518.027 = 5688.29 + 10 / 11
471.842 = 5180.27 + 10 / 11
429.857 = 4718.42 + 10 / 11
391.688 = 4298.57 + 10 / 11
356.989 = 3916.88 + 10 / 11
325.445 = 3569.89 + 10 / 11
296.768 = 3254.45 + 10 / 11
270.698 = 2967.68 + 10 / 11
246.998 = 2706.98 + 10 / 11
225.453 = 2469.98 + 10 / 11
205.866 = 2254.53 + 10 / 11
188.060 = 2058.66 + 10 / 11
171.873 = 1880.60 + 10 / 11
157.757 = 1718.73 + 10 / 11
143.779 = 1577.57 + 10 / 11
131.618 = 1437.79 + 10 / 11
120.561 = 1316.18 + 10 / 11
110.510 = 1205.61 + 10 / 11
101.373 = 1105.10 + 10 / 11
93.066 = 1013.73 + 10 / 11 (rate limited at faster than 100ms !!)
After 27 requests (270 ms) the bot gets 429 from the server (too many requests). If it’s silly enough to continue it gets worse. Let’s say that we have a ban threshold at 50ms (default would be anything twice as fast as the rate limit)
85.515 = 930.66 + 10 / 11
78.649 = 855.15 + 10 / 11
72.409 = 786.49 + 10 / 11
66.735 = 724.09 + 10 / 11
61.578 = 667.35 + 10 / 11
56.889 = 615.78 + 10 / 11
52.626 = 568.89 + 10 / 11
48.751 = 526.26 + 10 / 11 (gets 418 response (I am a teapot))
At this point the ip/session/tracker is added to the block-list, probably with an extended expiration (maybe 10 minutes, maybe the next day, maybe forever (until administratively removed) depending upon policy etc.
Any further requests while block-listed will receive:
503 – I am a combined coffee/tea pot that is temporarily out of coffee (Hyper Text Coffee Pot Control Protocol)
Here is a screen shot of this up and running… In this case Seinfeld fans will recognize the 503 response “No soup for you!”; and the automated block-list entry lasts for 10 minutes…
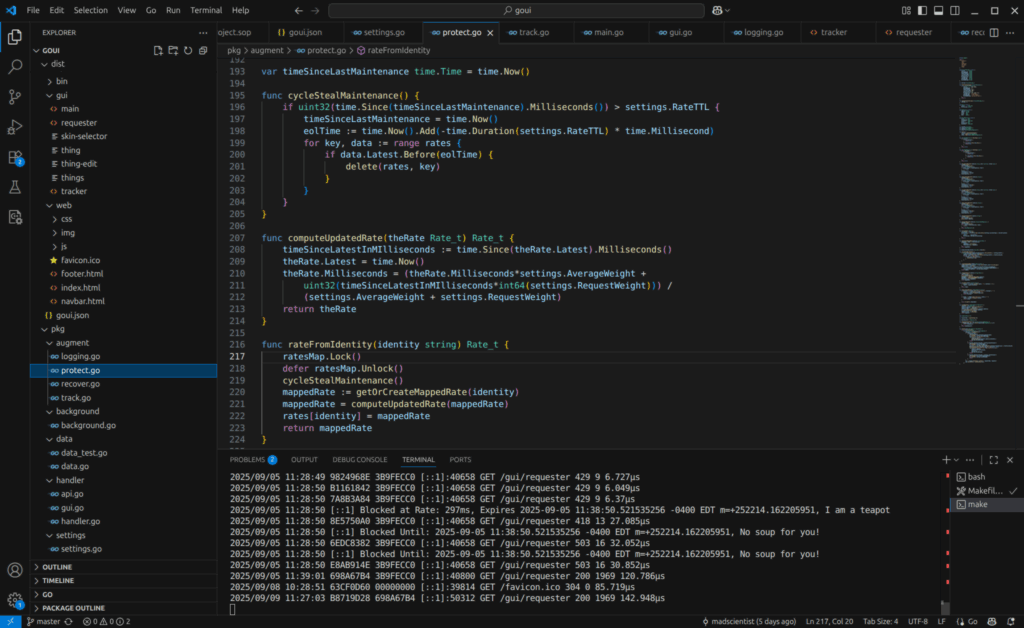
In the code above, if you look closely, you’ll see that I use a cycle stealing technique to do maintenance on the block/allow list and request rate tracking. This avoids the complexity of having a background process running in another thread. The thinking is: Since I already have the resources locked in a mutex I might as well take care of everything at once; and if there are no requests coming in then it really doesn’t matter if I clean up the tables until something happens… This is simpler than setting up a background process that runs in it’s own thread, has to be properly started up and shut-down, and must compete for the mutex at random times.
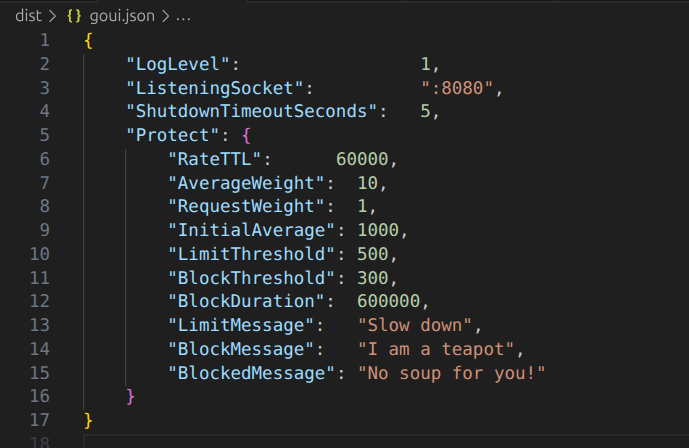
The configuration so far is very straight-forward…
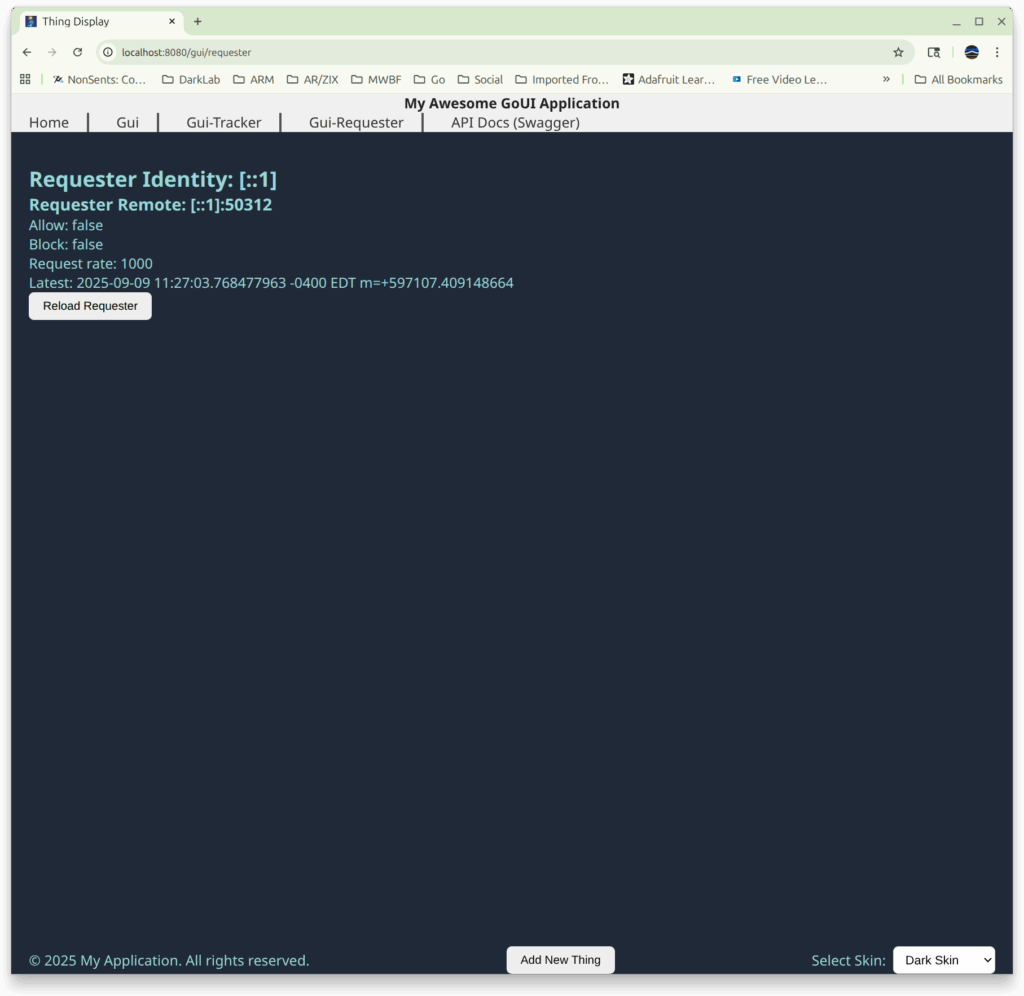
When a requester goes away for a while and is forgotten, they start over with a “benefit of the doubt” rate of 1 request per second… and the system tracks them from there. I created a UI widget to inspect the state of the rate limiter so I could watch it work…